29 August 2013
People living, working and sleeping in big cities during the hottest times of the year are prone to wilting, and with climate change that will only get worse. But a new heat visualisation experiment by Arup aims to do something about it. Rod Sweet reports
It’s called the Urban Heat Island effect, or UHI, meaning cities heat up more than the countryside because buildings, roads and pollution soak up the sun’s energy and store it, while waste heat from traffic just adds more.
And the storage aspect of UHI means that unlike their country cousins, inner city dwellers get no relief when the sun goes down.
Following a project to visualise how high temperatures affect urban areas and communities, Arup is now doing more research on how this data can be used to help plan for and mitigate the risks of hot weather in cities.
Using the latest data from the UK Space Agency and University College London (UCL), plus Geographic Information Systems (GIS), Arup has mapped land and air temperatures for Greater London and the surrounding counties.
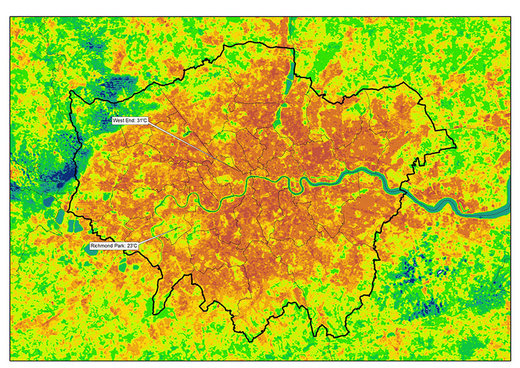
Visualisation of temperatures in Greater London on a summer day shows the City of London at 31°C, while less built up Richmond Park is relatively cool at 23°C. (Arup/UK Space Agency)
You may have felt that cities are hotter in summer, but these images prove it.
One summer day image shows the City of London baking at 31°C while less built up Richmond Park is deliciously cool at 23°C, and the maps give far more precise variations in between.
Polly Turton, senior consultant in advanced technology and research at Arup, believes recent high temperatures have affected not just the health and comfort of Londoners, but patterns of economic activity as well.
“The UHI affects cities across the globe and this is likely to become more pronounced due to climate change,” she said.
Damien McCloud, associate in GIS at Arup said that being able more accurately to identify hot and cool spots in a city will help planners manage the risk of hotter weather.
So the next stage of Arup’s Urban Heat Risk Mapping project aims to further visualise and explain correlations between land and air temperature, population density, areas of deprivation, building heights and land use.