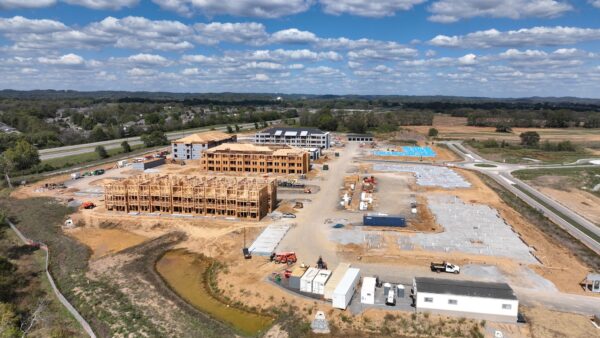
We recently supported Shell with monitoring progress on a multi-billion-dollar petrochemicals plant in Pittsburgh, Pennsylvania. It included the movement of 300 miles of pipe, more than 1,600 items of manufactured equipment, and 294 pre-assembled modules. Â
The construction workforce reached its peak in 2019 with up to 8,500 workers onsite, including more than 30 contracting companies. The scale of the project meant the project team needed a digital approach to manage the flow of information across the busy site.
Shell chose iHawk, our cloud-based, IoT-enabled visualisation platform to help it make evidence-based decisions, develop and adjust execution plans, stay on top of progress and costs, ensure quality and keep people safe.
It helped with Covid restrictions
Some 700 users from Shell and over 30 contractors managed the project using the same data in real-time: in the office, on site or on mobile devices.
Shell was able to combine multiple layers of geospatial information such as Orthophotos (an aerial photograph that has been geometrically corrected such that the scale of the photograph is uniform), mesh models, ground cameras, with IoT as well as third party API integration into a single source of truth. Â
This allowed the project teams to stay on track, even allowing for remote working when Covid-19 took hold, resulting in global travel restrictions and social distancing measures.
Data dilemma
The technology offered a solution to an old problem in construction: efficiently gathering, cataloguing, and managing large volumes of site inspection imagery.
Typically, this involves a combination of approaches including drones and on-the-ground 360-degree cameras, and data collection from a myriad of IoT-based field sensors.
This leaves project managers wondering how to interpret the sheer scale of data at their fingertips, and how best to update and share it.
We worked with Shell to develop a simple workflow to capture, upload, geotag and link images of equipment and data to create a multi-angle perspective on the events which take place on their construction site and when they happen. The images were then instantly shared across the project team.
Getting to grips with Gannt
This enabled real-time equipment location tracking and performance monitoring, allowing the team to plan heavy equipment moves and oversized deliveries, organise equipment staging, identify remedial issues, and manage congested laydown areas across the busy, 380-acre site.
Additionally, it solved a second common issue in the construction industry: the challenge of managing data offline using traditional Gannt charts.
By adopting a digital approach, the project teams can work from the same plans, which are instantly updated, allowing them to quickly detect space planning clashes and constraints.
From a safety perspective, iHawk’s emergency response and egress planning features meant the location of every muster point, fire extinguisher, first-aid kit, and defibrillator were clearly marked in the portal for the ease of planning, maintenance and communication.
Even contractors unfamiliar with the site layout can locate life-saving equipment at the tap of a tablet or touch of a smart phone.
A new era of data management
Large-scale construction projects demand new ways of working, and as we get used to the “new norm”, many project teams are prioritising remote data management and site visualisation to not only make their operations more efficient, but to reduce the number of people that need to travel and visit a site in person.
State-of-the-art data capture methods and visualization tools can empower project managers to make better decisions and achieve better results.
Image: Shell’s new petrochemicals plant in Pittsburgh, Pennsylvania, captured by Cyberhawk’s drones